
Getting the keys to your new home is a moment flush with excitement: There’s nothing quite like observing your brand-new blank canvas, soon-to-be decorated and filled to the brim with future moments and memories. Of course, before you get to that blissful step, there are many factors to consider: your existing debt, negotiation tactics, whether the house you choose will suit your future self – and, most importantly, where you want to live.
Another factor you can’t forget about is homeowners insurance. Unfortunately, even when you pick the perfect house in the perfect place, you can’t guarantee that everything is going to go perfectly. Homeowners insurance is the best way to wholly protect your property in case of disaster. It’s typically required if you have a mortgage, too.
“Which city suits me best?” is a question that calls for significant consideration, and the answer may change over time. In your 20s, you might have your eyes set on a place that can offer a wealth of employment opportunities and a vibrant downtown core. In your 30s, you might start prioritizing your children’s education and seeking out neighborhoods close to high-quality schools. As you get older, a quieter lifestyle centered on relaxation and socialization may come into focus.
In short, pinpointing the best place to purchase a home can be challenging – a challenge so perplexing, we just had to take a crack at it! We surveyed over 1,000 people about the most influential homebuying factors, then examined the most desirable locations by combining data from the top four: affordability, crime rates, commute times, and community well-being. Continue reading to see what we learned.

It’s Time to Switch Your Homeowners Insurance
We partner with the nation’s top homeowners insurance companies so you can get a custom policy at an affordable price.
Location, Location, Location
Aspiring homeowners are up against some significant hurdles: inflated demand, short supply, and wages that cannot keep up with the price of real estate. In response to these trends, migration to urban centers has taken a dip. In 2011, 26.7 percent of the nation’s population growth took place in big cities, dropping to 20 percent by the next census in 2015.
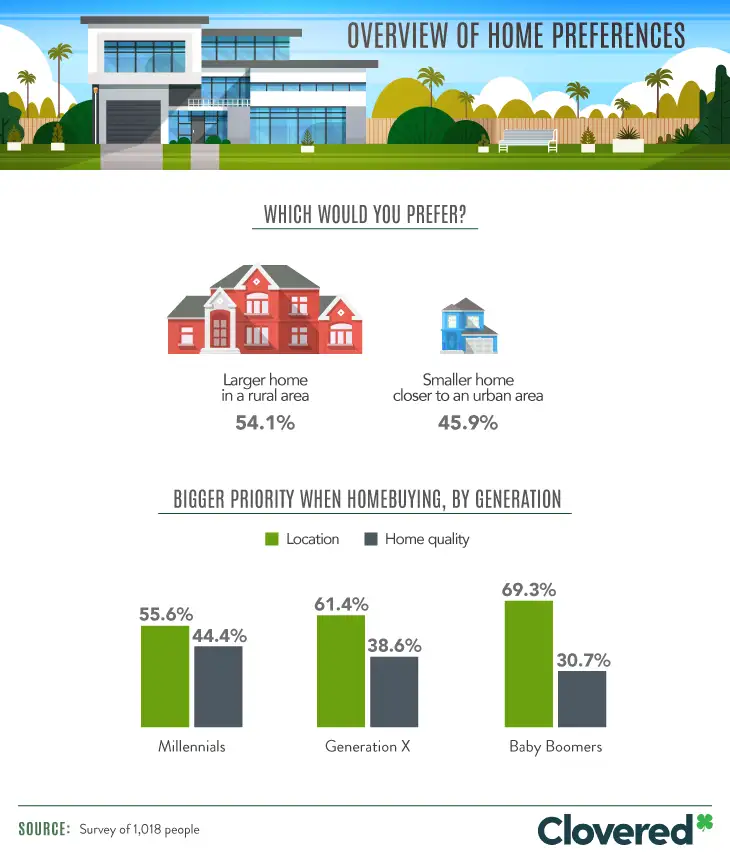
Our respondents seem to be taking cues from this housing situation, with 54.1 percent reporting they would prefer to have a larger home located in a rural area, as opposed to a smaller slice of real estate closer to the city. However, a word to the wise: While rural life is often imagined to be neighborly and idyllic compared to the cold, isolating big city, a recent Pew Research Center study revealed this is sometimes inaccurate.
The study showed that urbanites and rural dwellers feel equally connected to their communities and reported nearly no difference in how busy they felt in their daily lives. Plus, while rural Americans were more likely to know their neighbors, city dwellers spoke to their neighbors more often.
As our respondents’ ages decreased, the location of their home became less important, while a desire for a quality home rose steadily. While 69 percent of baby boomers prioritized where they lived, just 56 percent of millennials felt the same. Meanwhile, 44 percent of the youngest generation was concerned about the quality of their home, compared to just 31 percent of baby boomers.
Four-Seasoned Bliss
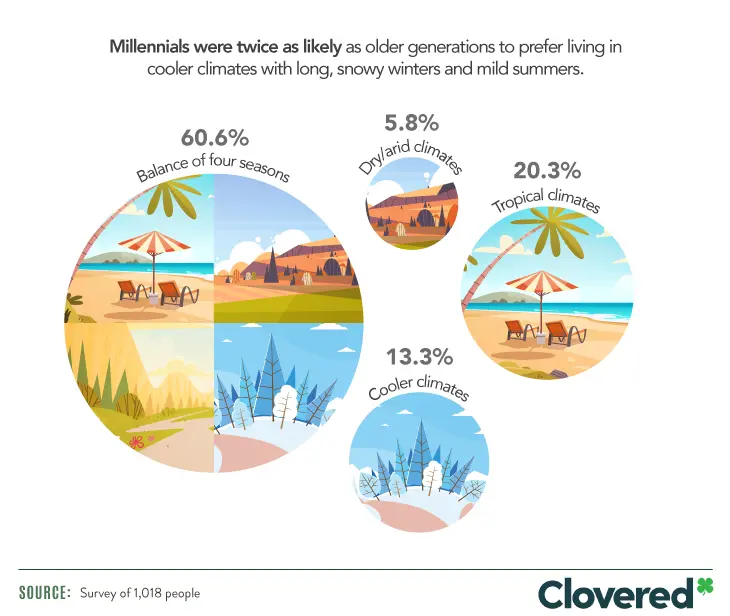
The majority of our respondents showed a preference for living in a climate with four distinct seasons, at just over 60 percent. Additionally, millennials were twice as likely as their older counterparts to enjoy a robust winter, firmly cementing the snowbird identity associated with older demographics.
Money Talks
In 2018, housing prices were expected to rise at least 6 percent, marking the sharpest increase since 2015, as well as the sixth year in a row that residential real estate surpassed the pay growth, inflation, and consumer price inflation rates. The silver lining? In 2019, this aggressive spike in price is expected to loosen its grip on the housing market.
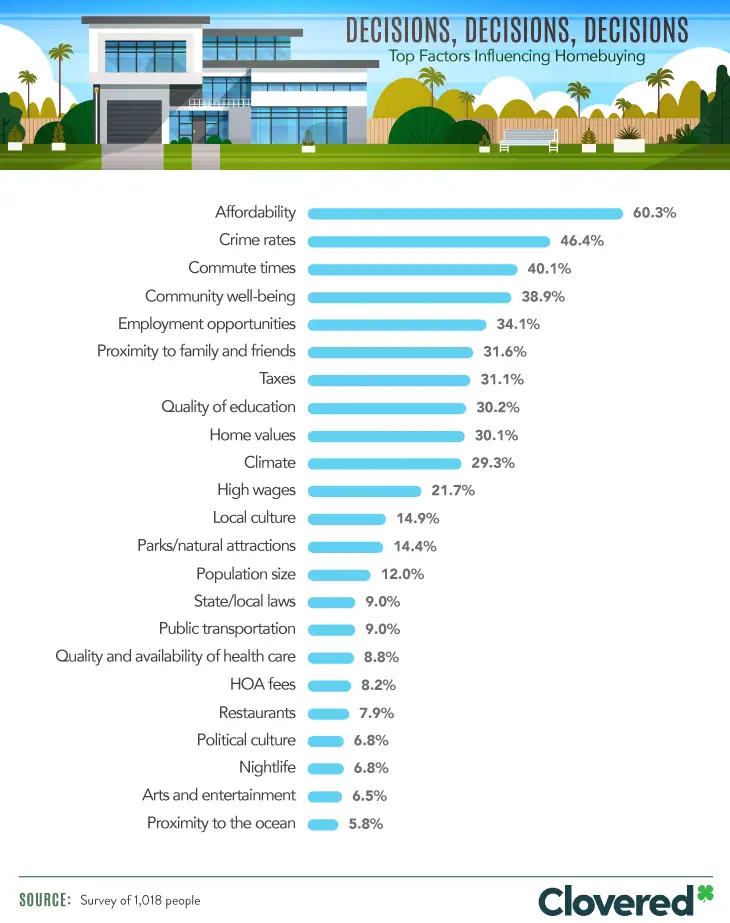
Our respondents were most concerned about affordability. When it came to the variables that influenced where they purchased property, 60.3 percent said the price tag associated with their new home along with affordability of the surrounding area was the top influential factor. Next up was the crime rate at 46.4 percent.
Commute times were another hot-button topic among our respondents, with roughly 40 percent listing their daily to-and-fro as a major factor in deciding on a location. And they may be onto something: A recent study found that each extra minute spent in the car or on the train contributes to reducing job and leisure time satisfaction.
The Generational Divide
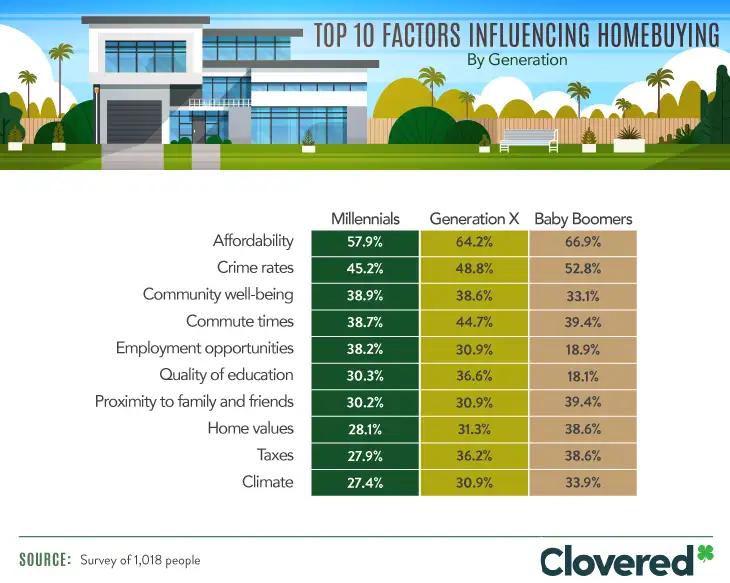
No matter their age, respondents prioritized affordability above all else. Just about 58 percent of millennials, 64 percent of Gen Xers, and 67 percent of baby boomers said prices would influence where they bought their home more than any other factor. Crime rates took a universal second as well.
Generational nuances began to reveal themselves a little further down each list. Among millennials, employment opportunities made the top five, whereas older generations did not care nearly as much. Given there are plenty of obstacles facing millennials as they enter adulthood, it is understandable that they would look to stack the odds of job opportunities in their favor.
With many baby boomers either retired or on the brink of retirement, maintaining a healthy social life in their post-work days is important. That may be why this demographic valued being close to family and friends at a rate of 39.4 percent. Meanwhile, Gen Xers were more concerned with the quality of the educational institutions in proximity to their home. Millennials ranked quality of education as slightly less important than Gen Xers but far more important than baby boomers.
And the Winner Is…
One of the most impactful choices we make as adults is where we choose to call home. The U.S. is a vast and varied tapestry of lifestyles, cultures, cuisines, and attitudes, making it an enormous task to actually nail down the most desirable places to live overall. But we decided to give it a go anyway.
We started by looking at the top 50 most populated metropolitan areas in the country. Then, based on the four most influential homebuying factors according to our survey, we pulled data from four sources to determine the very best place to hang your hat.
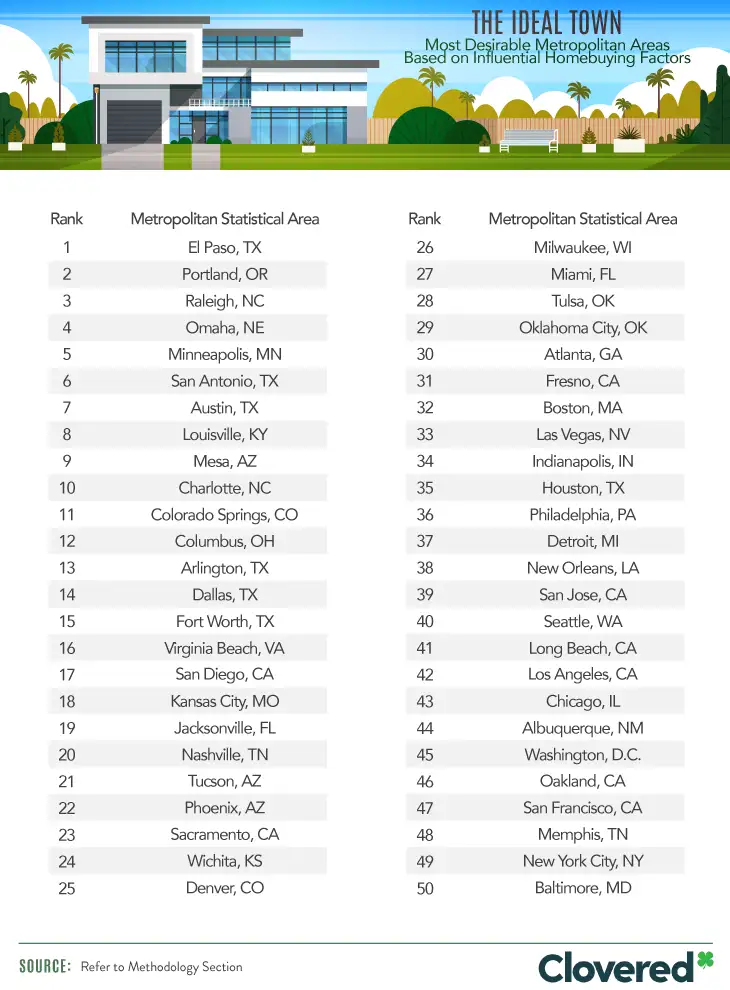
El Paso, Texas, and Portland, Oregon, were the top two best spots for affordability, low crime rates, reasonable commute times, and community well-being. The former sits directly on the border of Mexico, snuggled right up against Ciudad Juárez. The aptly named “Sun City” boasts more than 300 days of sun per year, as well as many adventurer-friendly sites. It sits at the foot of the rugged Franklin Mountains, features a picturesque scenic lookout, and has multiple larger-than-life parks to explore.
Travel to the northwest U.S., and you’ll find Portland. Known for its quirky motto, “Keep Portland Weird,” this Oregonian locale is worlds apart from El Paso but surprisingly similar in a couple of key ways. Like El Paso, Portland sits directly on a border – this time with Washington, directly on the other side of the Columbia River. Its skyline also features Mount Hood.
Raleigh, North Carolina, rounded out the top three places to live, a vibrant yet quaint metropolis that boasts good food, solid educational options, and a unique cultural vibe. Meanwhile, Memphis, New York City, and Baltimore came in 48th, 49th, and 50th place, respectively.
It’s Time to Switch Your Homeowners Insurance
We partner with the nation’s top homeowners insurance companies so you can get a custom policy at an affordable price.
Metros by the Numbers
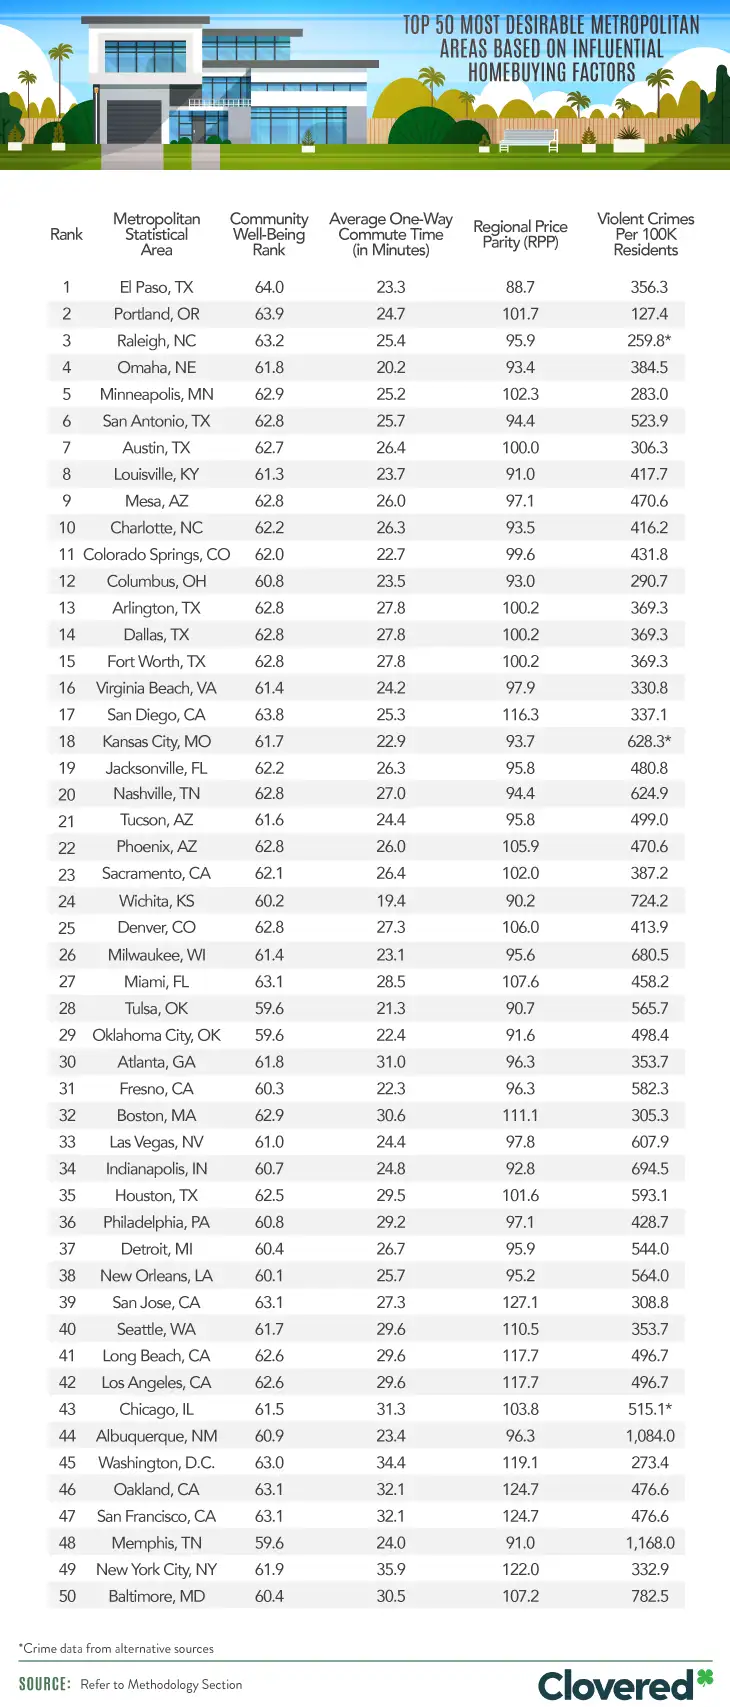
El Paso was a hair ahead of Portland when it came to its well-being score and average commute time, but this Texan outpost truly shined when it came to regional price parity (RPP) (a calculation that shows how much a certain amount of cash will buy you in a given place, based on a national average indexed at 100). While Portland was just barely above the national average at 101.7, El Paso came in at 88.7 – the lowest of all 50 cities – indicating an extremely competitive cost of living.
On the flip side, two Californian locations – San Francisco and Oakland – were among the top three cities on the charts with an RPP of 124.7. With the average apartment in San Fran renting for nearly $3,500, real estate prices are only the tip of the unaffordability iceberg for many cities in California.
The one category in which Portland truly won out was the crime rate. With 127.4 violent crimes per 100,000 residents, this Oregonian oasis was a bit safer than El Paso, which clocked in at 356.3 violent crimes per 100,000 residents. However, Memphis had the highest crime rate of all 50 cities, with 1,168.3 violent crimes per 100,000 residents.
Deciding Factors
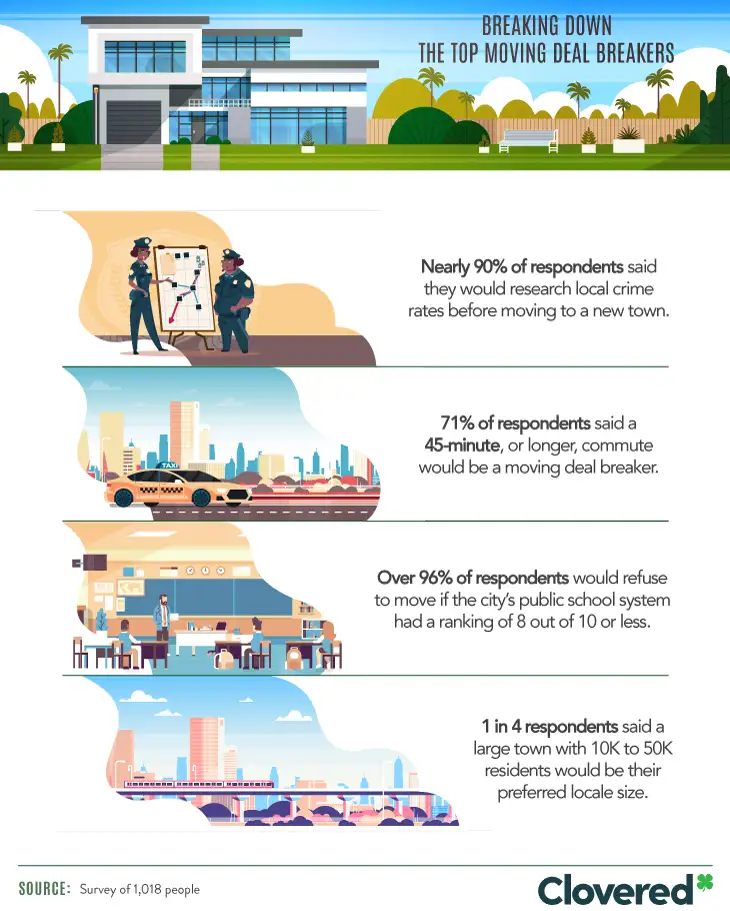
Our survey findings indicate that potential homebuyers take several factors into account when narrowing the list of places to move. There were a handful of very common location-related turn-offs for our respondents, including commutes that exceeded 45 minutes and public school systems that scored worse than eight out of 10.
Coveted Cities
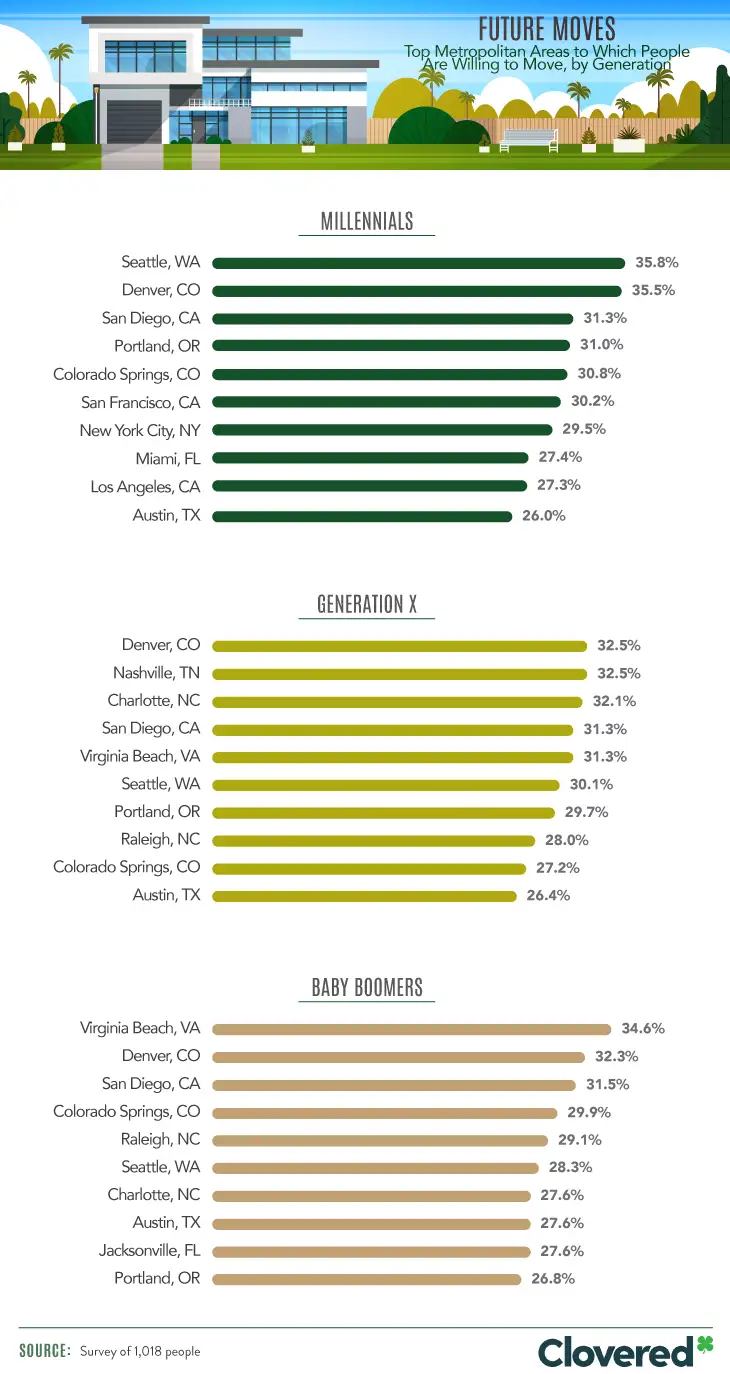
When we asked respondents of each generation where they would most like to move, some cities proved to be universally attractive, while others garnered varying levels of interest.
A competitive housing market, a healthy job market, five-star weather … it’s no wonder that Denver was the only city to make all three generations’ top two most desirable cities. While Gen Xers ranked it, tied alongside Nashville, Tennessee, as their No. 1 pick (32.5 percent), an almost equal share of baby boomers (32.3 percent) and an even greater percentage of millennials (35.5 percent) felt it was a highly suitable option.
But does Denver truly earn its recognition? According to our rankings, it was smack in the middle, taking 25th place out of the 50 most populous metropolitan areas. While millennials may have fallen in love with Seattle for its status as a coffee capital and tech hub, it ranked 40th on our list due to an elevated cost of living, plus middling commute times and crime rates.
Baby boomers’ choice of Virginia Beach, on the other hand, made them the only ones to favor a city that made our top 20. This location took 16th place, with a pretty good RPP and fairly reasonable commute times. As long as you don’t mind the sound of passing jets, there’s a lot to love about this resort city, from glorious views to delicious local cuisine.
San Diego, just one slot below Virginia Beach on our list, made everyone’s top four. However, noticeably absent from all three generations’ top 10 lists was El Paso. Meanwhile, Portland ranked 10th among baby boomers, seventh for Gen Xers, and fourth among millennials.
Finding the Best Places to Live
Choosing a place to live is contingent on many factors. For some, it’s all about the food, drinks, and nightlife. For others, local schools and the quality of education are paramount. An abundance of hiking trails and challenging peaks might entice some people, while others may seek a beachfront lifestyle.
Measuring a city’s livability is a true challenge, but according to our respondents’ four most important factors – affordability, crime, commute times, and community well-being – El Paso, Texas, Portland, Oregon, and Raleigh, North Carolina, reigned victorious. Meanwhile, historical heavyweights like New York City and San Francisco found themselves in the bottom five.
Whether you’ve chosen to set up shop in a foodie epicenter or an outdoorsman’s paradise, homes across the country have one thing in common: They must be protected with a homeowners insurance policy. Don’t let your future go up in smoke – contact Clovered’s team of professionals to get set up with the coverage you need at a great price.
Methodology
To conduct this research, our team of experts administered online surveys to 1,018 people through Amazon’s Mechanical Turk service. Of the respondents polled, 62 percent identified as millennials, 25 percent as Generation X, and 13 percent as baby boomers. Survey takers were disqualified if they failed to answer an attention-check question correctly or entered inconsistent data points. The survey results are comprised of answers from both homeowners and non-homeowners. To determine the most influential homebuying factors, respondents were presented with an expansive list of factors and had the option to select all that applied.
Our team created a meta ranking of the most desirable locations to live in the U.S. by combining data from the top four influential homebuying factors: affordability, crime rates, commute times, and community well-being. To do this, we pulled data from the following sources:
- Affordability: We pulled numbers from the Bureau of Economic Analysis: Regional Price Parities 2017 to determine the most affordable metropolitan areas in the U.S. The regional price parity is an index that sets the national cost of goods and services at 100, with a particular area’s RPP displaying how the cost of living in that region compares to the national average.
- Crime Rates: By analyzing the FBI’s annual Uniform Crime Reports(UCR) from 2017, we identified the top metropolitan areas with the highest and lowest violent crime rates per 100,000 inhabitants.
- Commute Times: Average one-way commute times were scraped from the U.S. Census Bureau’s American Community Survey from 2012 to 2016.
- Well-Being: To determine the happiness and well-being of each metropolitan area, we pulled figures from Gallup’s 2017 Community Well-Being Rankings. The report examines well-being across the country, with communities being ranked based on their well-being index scores. The analysis rates regions across five elements of well-being: purpose, social, financial, community, and physical factors.
Geographic types were segmented by the top 50 most populated metropolitan statistical areas within the U.S.
Limitations
The most desirable locations were created using a meta ranking of the top four most influential homebuying factors from our survey findings. One major limitation of this study is that we only compared these factors between the top 50 most populated metropolitan statistical areas based on the U.S. census population data from 2016. The FBI’s 2017 UCR failed to report data for Chicago, Illinois, Raleigh, North Carolina, and Kansas City, Missouri. Instead, we pulled the most recent number of violent crimes per 100,000 inhabitants from city-data.com for each metropolitan area.
Additionally, the survey results of this study rely on self-reported data, which is subjected to exaggeration or telescoping. Generations with insufficient sample sizes were excluded from specific breakdowns. The top cities respondents were most willing to move to were established through a select-all-that-apply question consisting of the top 50 most populated U.S. metropolitan areas, according to the 2016 U.S. Census Bureau population data.
It’s Time to Switch Your Homeowners Insurance
We partner with the nation’s top homeowners insurance companies so you can get a custom policy at an affordable price.
The editorial content on Clovered’s website is meant to be informational material and should not be considered legal advice.